

Molecular properties of soil organic matter in dark buried colluvium from South Germany show abundance of fire residues from Early Neolithic vegetation clearance and slash and burn agriculture
By Joeri Kaal and Sonja Mailänder (Institute of Geography, University of Stuttgart)
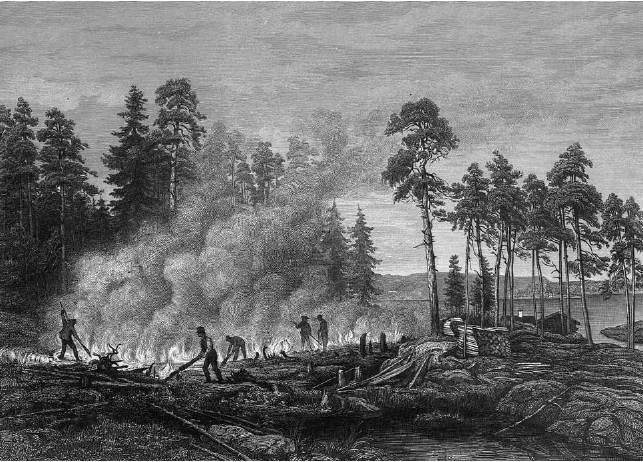
Title image in slider: Berndt Lindholm (1841–1914), Slash-and-burn in Idensalmi (Svedjeland i Idensalmi, Savolaks), from Zacharias Topelius (En resa i Finland, Helsingfors Bokförlaget Atlantis, Stockholm 2013) (https://commons.wikimedia.org/wiki/File:B_Lindholm_Svedjeland_i_Idensalmi.jpg)
Geoarchaeological surveys in South Germany (Nördlinger Ries area) showed continuous presence of human occupations since the Palaeolithic and remarkable colluvial soils containing dark buried layers dated to the Neolithic. Here we discuss molecular properties of soil organic matter (SOM) from three of these colluvia by Py-GC-MS. The pyrolysis products could be ascribed to four different SOM components: labile SOM (fresh lignin and polysaccharides), a recalcitrant aliphatic fraction, degraded/secondary SOM (including chitin and degraded carbohydrates) and pyrogenic SOM (Black C, from palaeofires). The Black C was recognised unambiguously from the full range of diagnostic compounds, i.e. abundant polycyclic aromatic hydrocarbons (PAHs) such as naphthalenes, biphenyl, fluorene, phenanthrene, anthracene and pyrene, and N-containing compounds such as benzonitrile, (iso)quinoline and naphthalene carbonitriles. Black soil layers generally contained larger proportions of pyrogenic material but SOM dynamics of these soils seem controlled by intense degradation, eliminating most components of fresh plant material and producing newly-formed degraded SOM (including chitin from fungi and/or arthropods) and a relative accumulation of aliphatic SOM. Nonetheless, the black colour of the Neolithic soil layers is clearly caused by the strong pigmentation of fire residues and reflects a series of (forest) fire events ca. 6000–7000 cal BP. This study shows the potential of Py-GC-MS to identify pyrogenic SOM and simultaneously identify the processes that control SOM dynamics in prehistorical anthropogenic colluvium.
1. Introduction
Pyrolysis-GC-MS is increasingly used for Black C identification and characterization in archaeological sites but also off-site anthropogenic dark earths such as worldwide Terra Preta deposits and colluvial deposits, despite the potential difficulties in distinguishing artificial thermal modifications (during analytical pyrolysis) and the “natural” thermal impact by fire. While many of the major pyrolysis products of Black C, e.g. benzene, toluene, C2-benzenes, pyridine and PAHs, are not specific of Black C, they tend to be enriched in Black C-rich soil and, if the chromatogram quality is optimized, accompanying compounds such as benzene carbonitriles or naphthalene carbonitriles may allow for a definitive identification of the pyrogenic SOM signal.
Excavations and geomorphological research in the study area by Sonja Mailänder and her colleagues Prof. Dr. Wolf-Dieter Blümel and Dr. Joachim Eberle showed a series of partially black-coloured colluvial deposits that formed the basis of a landscape reconstruction exercise, i.e. the PhD research of Sonja Mailänder. For details of this research, the study area, and the deposits we examined by analytical pyrolysis, please refer to Mailänder et al. (2010, 2011).
Aiming to elucidate soil formation processes and to seek for indications of human activities (anthropogenic remains and land use strategies), we performed Py-GC-MS to the SOM from the three soil profiles, with special interest in the nature of the SOM in the buried dark layers.
2. Methods and materials
2.1 Study area, background, sampling
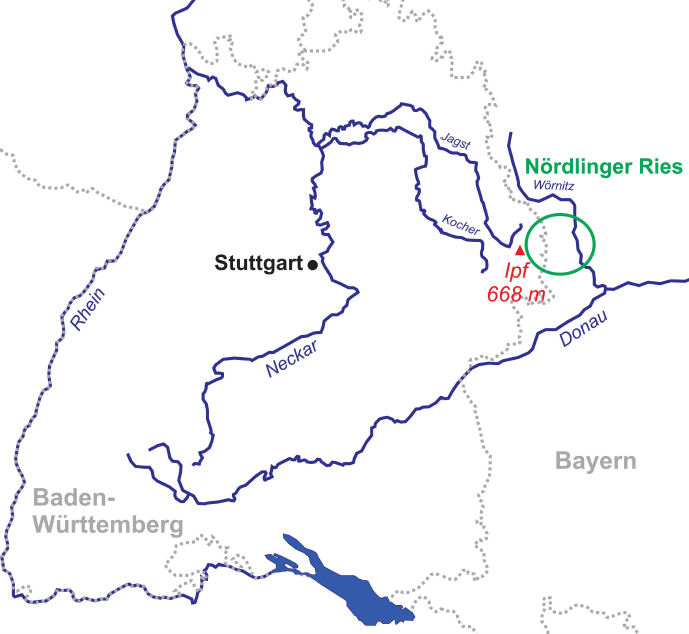
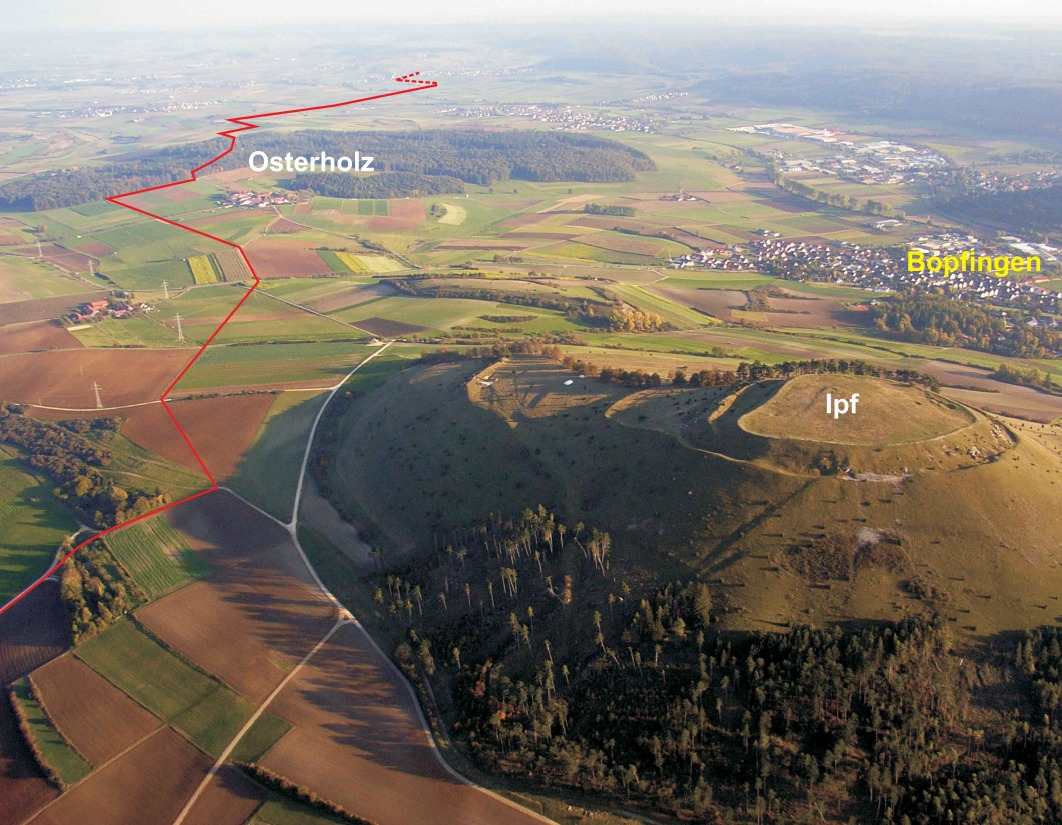
The study area is located nearby the Ipf Mountain (Nördlinger Ries, South Germany, 80 km east of Stuttgart), which is on the border of a crater that formed upon a Miocene meteorite impact 15 million years ago (Figures 1 and 2). Figure 3 shows the colluvial deposits (taken from a pipeline trench), samples analysed, and radiocarbon dates.
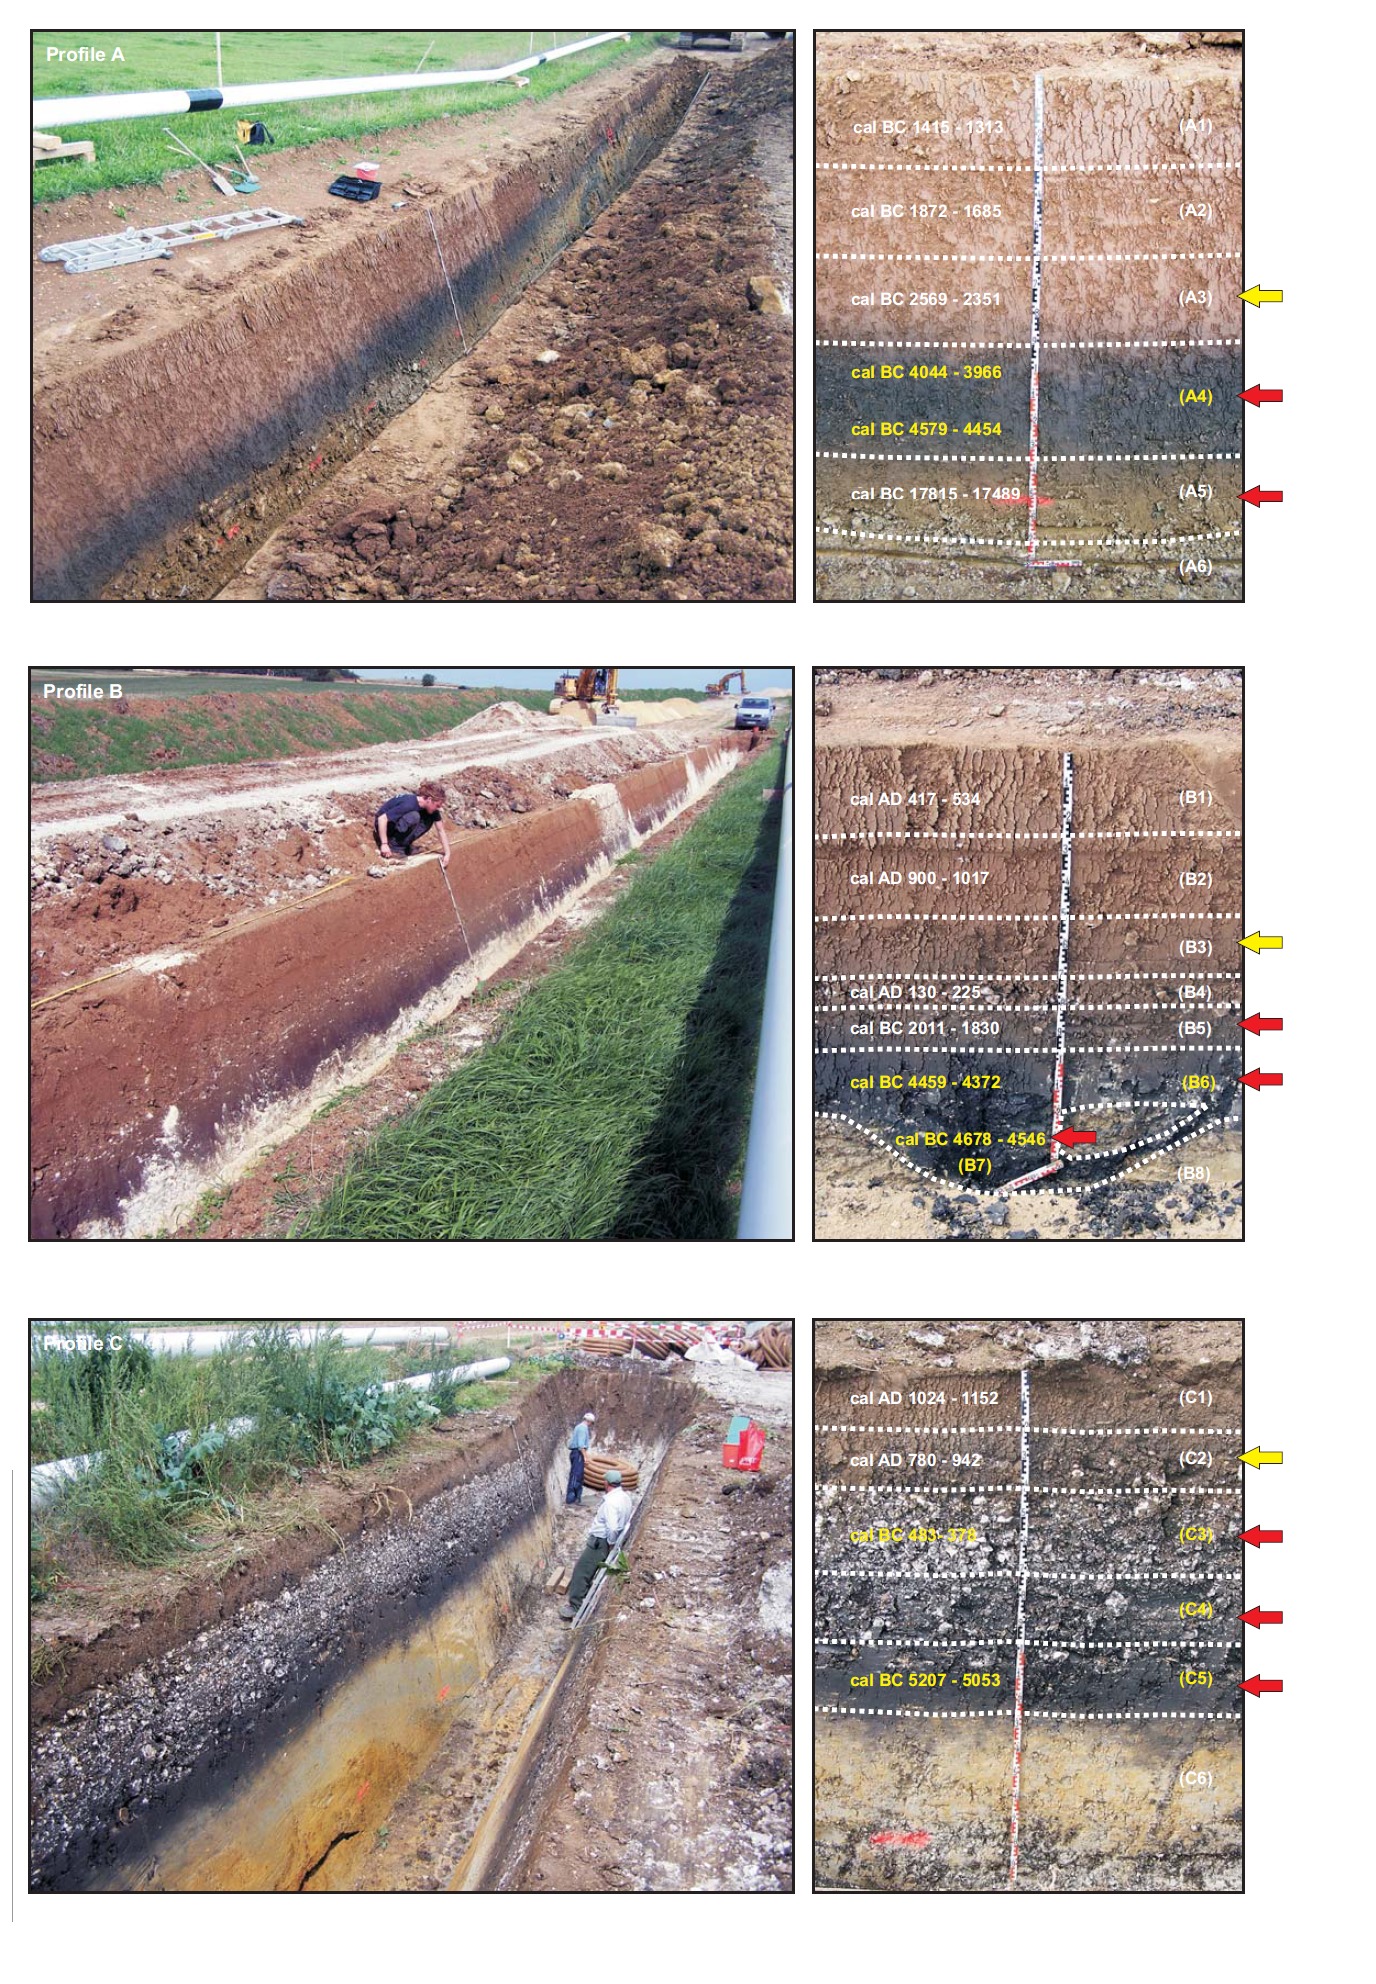
Profile A is located to the north-east of the Ipf hill in the upper reaches of the Goldbach Valley. This valley has no watercourse anymore and is used as grassland and grazed by cattle. In the pipeline trench the black layer (A4), which was covered by colluvial deposits, appeared in the deepest part of the depression and lashed out to the left and to the right. A calcareous-rich layer was found underneath layer A4 (A5). The geological substrate is composed of the Upper Aalenian (Aalenian 2, al2E, former Brown Jurassic β).
Profile B is situated further east within the outer ring of the Ries crater, nearly on top of a small depression, which runs to the Goldbach Valley from the west. Today this area is used for agriculture. The underlying bedrock is a dislocated Upper Jurassic megablock. In profile B a dark layer (B6) was found as well, at the deepest part of the depression lashing out to the slopes and covered by colluvial deposits. In the position of the investigated profile in the pipeline trench, a small pit-like structure appeared underneath (B7).
Profile C was studied on the south-facing, gently tapered slope of the Eger Valley, also within the megablock zone of the crater. Here the basement is built of Bunte Breccia that is a product of the meteorite impact. It consists of multicoloured chaotically mixed rock fragments, which originate from different bedrock formations. On top of a very clayey black horizon (C6), poor in coarse particles, two further dark layers (C5 and C4) are found, which contained many pieces of Upper Jurassic limestone.
2.2 HF treatment
Minerals that catalyze secondary rearrangements during pyrolysis were eliminated by HF treatment. Briefly, 2.0 g of sample were transferred into 50 ml centrifuge tubes and 10 ml of 1 M HCl were added repeatedly to remove carbonates. After the reaction was completed, H2O was added until the 25 ml mark and the resulting suspension was agitated, centrifuged (2500 rpm for 10 min) and the supernatant discarded. Next, 2 % HF solution was added until the 25 ml mark and shaken for 24 hrs, followed by centrifugation and decantation of the supernatant. This HF treatment was repeated 5 times, after which the procedure was executed three times with H2O to wash away the acid and silicates. Finally, the residue was dried at 35 ºC.
2.3 Pyrolysis-GC/MS
Pyrolysis-GC-MS was performed using a Pt filament coil probe resistive heating pyrolyzer (Pyroprobe 5000) from CDS Analytical Inc (Oxford, USA). The pyrolysis interface was connected to a 6890 GC and 5975 MSD from Agilent Technologies (Palo Alto, USA). Approximately 1 mg of sample (HF-treated residue) was embedded in fire-polished quartz tubes using glass wool. Pyrolysis was performed at 750 ºC (750 ºC setpoint temperature is approximately 670 ºC real pyrolysis temperature which is still very high, but found ideal for Black Carbon characterization by Kaal et al. 2009) for 10 s at a heating rate of 10 °C ms-1. The pyrolysis interface and GC inlet were set at 325 °C. The GC oven was heated from 50 to 325 °C at 20 °C/min and held isothermal for 5 min. The GC-MS transfer line was held at 325 °C, the ion source (electron ionisation mode, 70 eV) at 230 °C and the quadrupole detector at 150 °C. The GC was equipped with a (non-polar) HP-5MS 5% phenyl, 95% dimethylpolysiloxane column (ca. 30 m x 0.25 mm i.d.; film thickness 0.25μm). Helium was used as carrier gas (constant flow, 1 ml/min). Two replicates were obtained for each sample. The ca. 50 largest peaks of the total ion current of each pyrolysis chromatogram were listed, giving rise to a compound list of 114 pyrolysis products. The relative proportions of the pyrolysis products were calculated from the peak area of their dominant and/or characteristic mass fragments. Relative proportions are expressed as the percentage of total quantified peak area (% TQPA). Two replicates were obtained for each sample.
3. Results and Discussion
3.1 Py-GC-MS products and source allocation
The list of compounds is provided in Table 1 at the bottom of this article. The pyrolysis products were grouped based on chemical structure and/or most likely origin. The markers of carbohydrates are 3/2-furaldehyde, 5-methyl-2-furaldehyde, 4-hydroxy-5,6-dihydro-(2H)-pyran-2-one, dianhydrorhamnose, levoglucosenone and levoglucosan. Of these compounds, levoglucosan, dianhydrorhamnose and 4-hydroxy-5,6-dihydro-(2H)-pyran-2-one originate mainly from relatively intact polysaccharides while levoglucosenone and the furfurals originate from degraded carbohydrates, even though there is no strict division between these two subgroups (intact polysaccharides also produce furfurals upon pyrolysis). An unidentified compound producing base ion m/z 116 was grouped here as it is possibly an indication of moss-derived carbohydrate (Schellekens et al., 2011), and was correlated to the three markers of intact polysaccharide (3x P<0.001). The seven carbohydrate products combined account for 12 ± 4 % of TQPA (Fig. 4a). This proportion decreases with depth in the three soils, which may be explained by preferential carbohydrate decomposition with time. In profiles B and C, the relative proportion of intact carbohydrate markers declines with depth, reflecting carbohydrate degradation. However, in profile A, sample A5, which is the only Late-Pleistocene/Early Holocene sample of the present study, produced a relatively large proportion of intact polysaccharide markers, probably because this layer formed under conditions with low microbial activity (cold and dry).
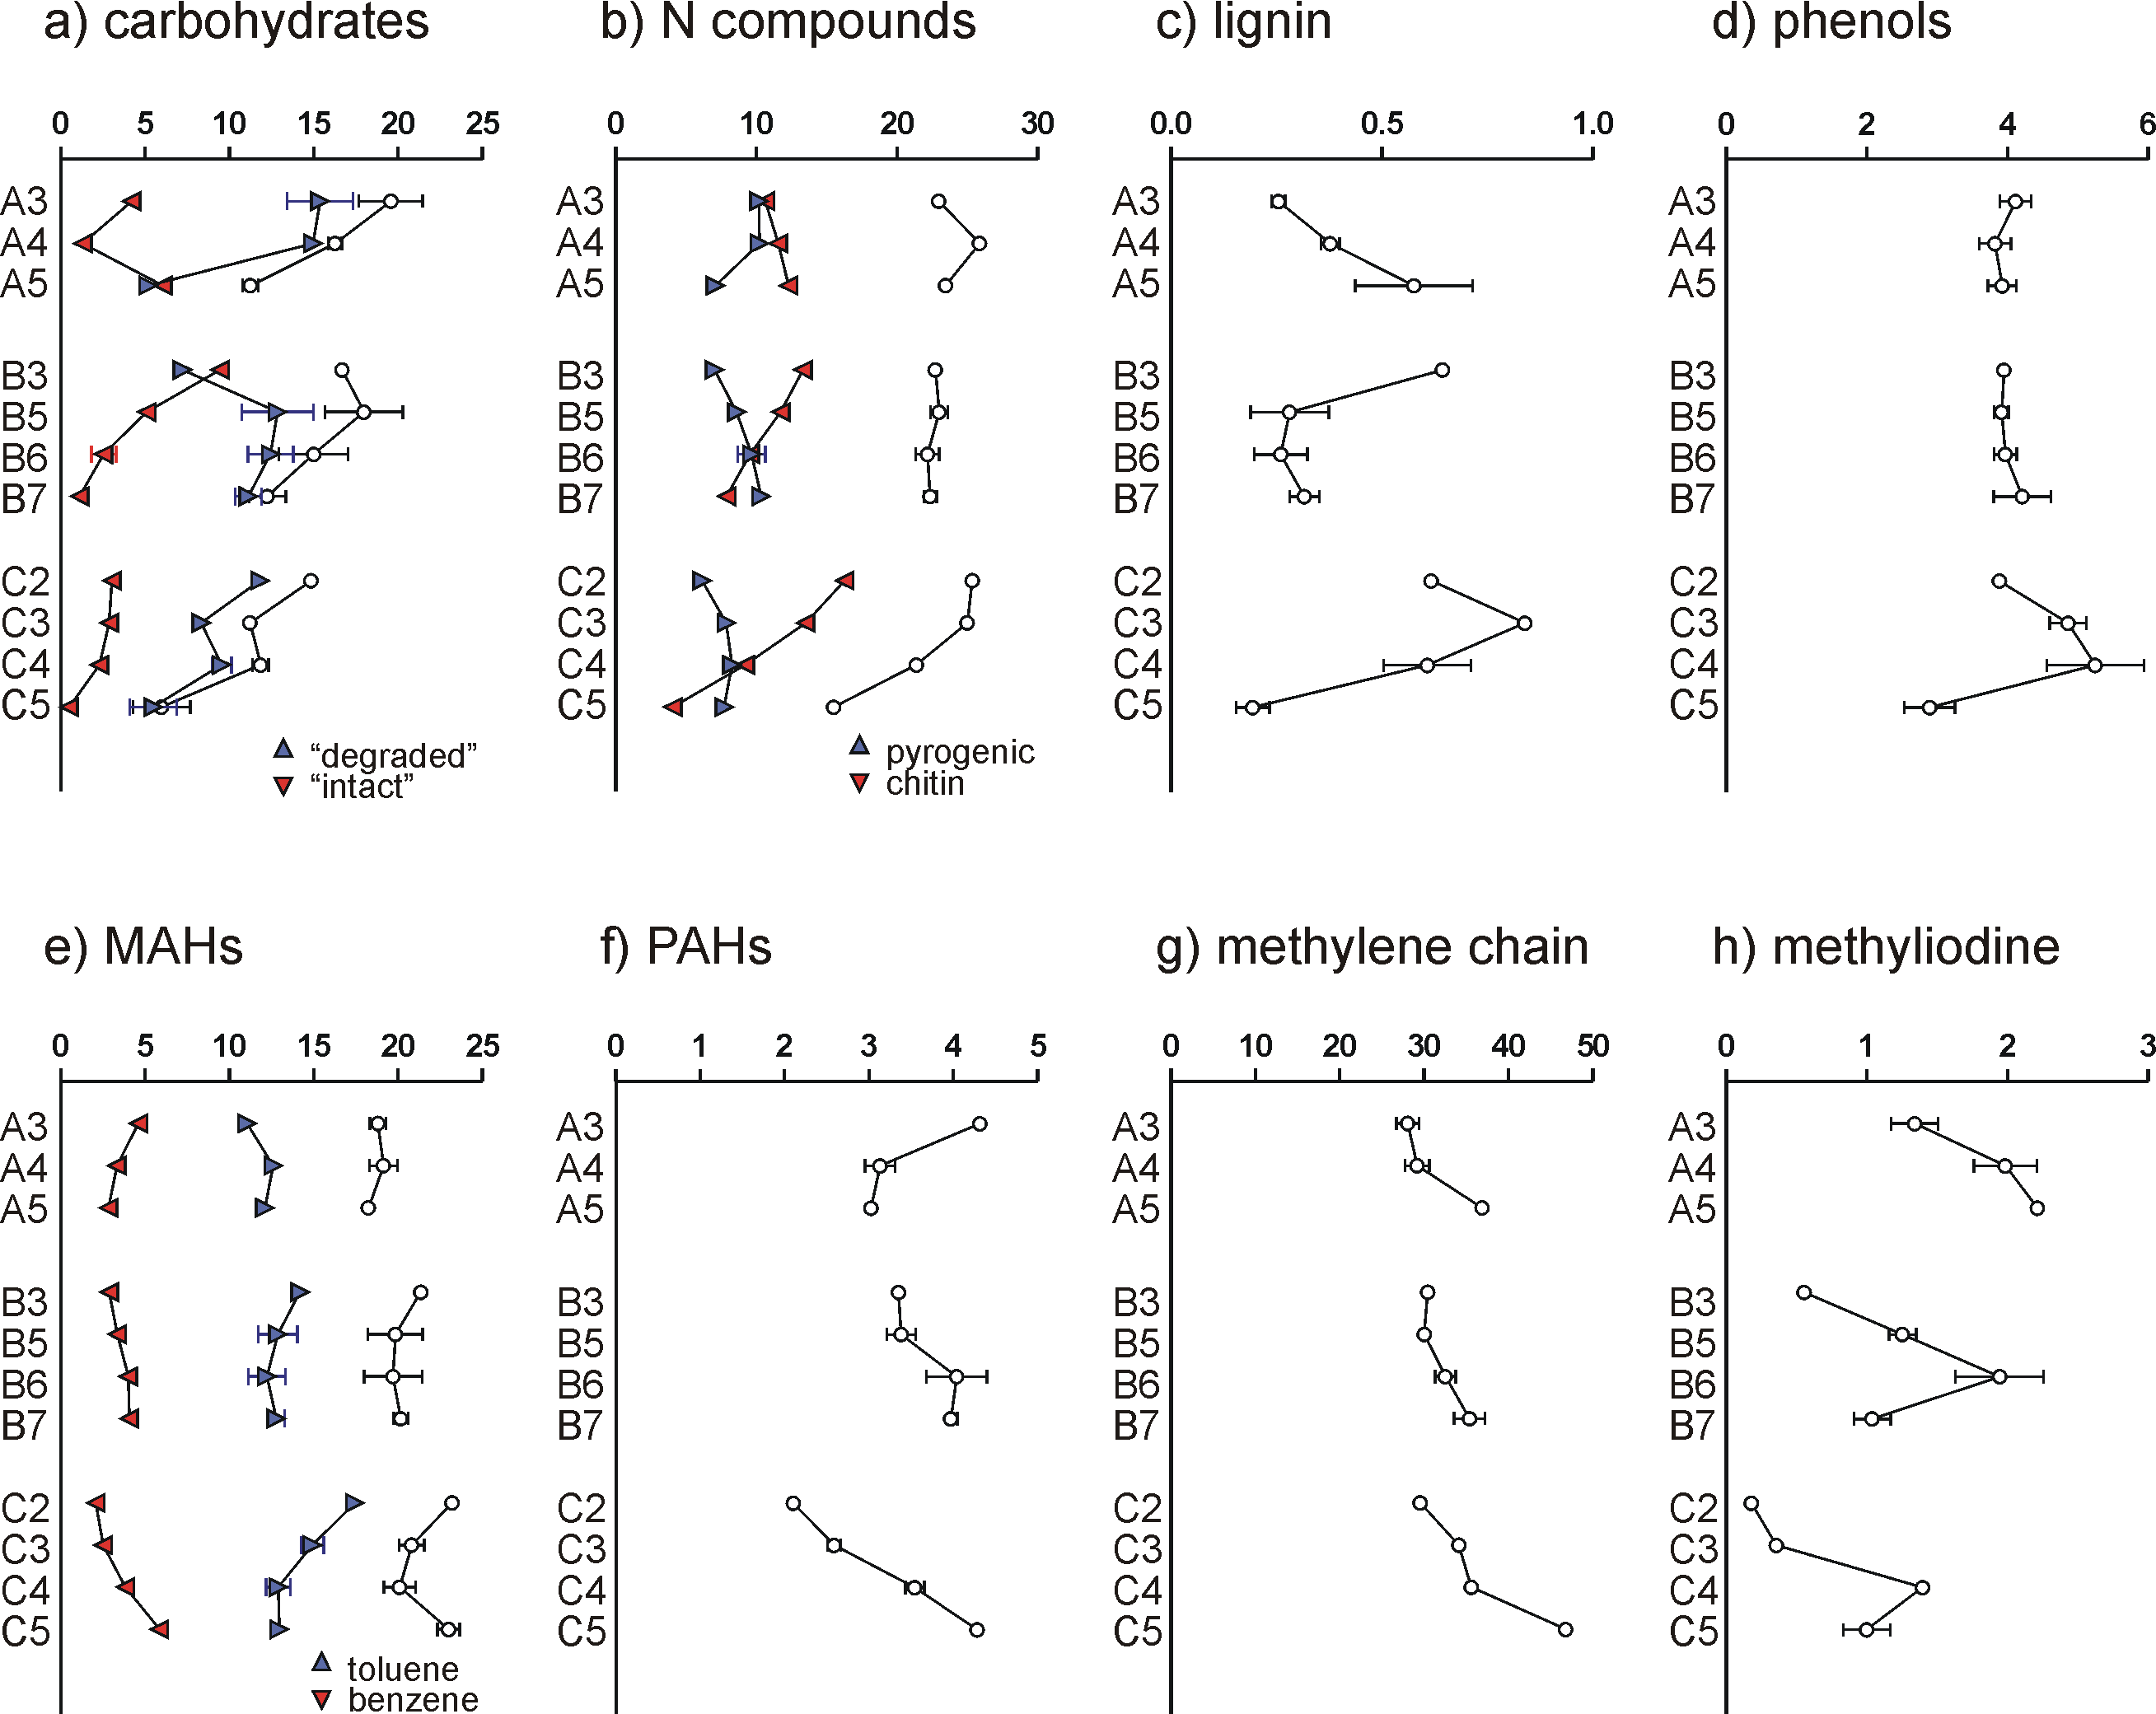
Pyrolysis products containing one or more atoms of N (N-containing compounds) are abundant, i.e. 23 ± 3 % of TQPA (Fig. 4b). These compounds have a diverse origin, and a VARCLUS cluster analysis using Tanagra software was performed to arrange them into subgroups. Two main clusters were obtained, accounting for 85 ± 4 % of total N-containing pyrolysis products. One cluster consists of (in decreasing order of cluster correlation coefficient) acetamide, C1-pyrrole, a compound with base ion m/z 94, benzeneacetonitrile, trianhydro-2-acetamido-2-deoxyglucose, 2,5-diketopiperazine, C1-pyridine, a compound with base ion m/z 109 (and m/z 66 and m/z 80 as daughter ions of two co-eluting isomers), indole and pyrrole. The compounds m/z 94, m/z 109 and trianhydro-2-acetamido-2-deoxyglucose are markers of the N-acetylglucosamine-based biopolymer chitin, which occurs in invertebrate/arthropod exoskeleta, fungi cell walls and also in molluscs. The diketopiperazine has been identified in pyrolyzates of chitin-entangled protein, and the other products can also be produced by chitin but are less specific. Therefore, the compounds in this cluster are thought to originate primarily from chitin. Chitin seems to be present in all samples (Fig. 4b). Its proportion declines with depth in profiles B and C. An unidentified compound with fragment ions m/z 59, 114 and 204, which could correspond to 1,6-dianhydro-2-acetamido-2-desoxyglucose, was identified in an isolated snail shell fragment from sample A4 (not shown). This compound, which could be a marker of mollusc chitin, was not found in the HF-treated samples. Nonetheless, it is difficult to decide on the source organism of the chitin markers. We believe that they are mainly arthropod-derived and/or fungal, either way being an indication of biological recycling of plant-derived SOM. The second cluster consists of two naphthalene carbonitrile isomers, benzonitrile, N-methylpyrrole, C1-benzonitrile and pyridine. The naphthalene carbonitriles (or naphthonitriles) and benzonitriles are markers of pyrogenic N (Kaal et al., 2009), and pyridine is a less-specific of it (e.g. Kaal and Rumpel, 2009). The depth trend of this pyrogenic N (or Black N; Knicker, 2010) is discussed below. The position of the N-methylpyrrole in this cluster cannot be explained (it is an unlikely product of pyrogenic material). Furthermore, we identified a set of phthalimides (three compounds), which we think are also markers of pyrogenic N. Diketodipyrrole (a dimerization product of protein pyrolysis), C16– and C18-alkylamide, and C16– and C18-alkylnitrile, were also detected but not associated with one of the aforementioned clusters.
In the present study, the guaiacyl- and syringyl-based pyrolysis products of lignin were scarce (0.5 ± 0.2 % of TQPA). Also, only guaiacol and 4-vinylguaiacol were detected. This implies that either lignin was not a significant source of the SOM or that it was profoundly remediated. Lignin is enriched in the SOM of the Early Holocene sample A5 (confirming the preservation of some lignocellulosic source) while it decreases with depth in profiles B and C, probably because of decay (Fig. 4c).
Considering the presence of lignin as well as pyrogenic matter and abundant degraded and secondary biomass, which all produce phenols upon pyrolysis, the phenols (4.1 ± 0.7 % of TQPA) cannot be ascribed to a specific SOM component. From the relative proportion of phenols in profile C (Fig. 4d), which shows a similar trend to that of the lignin markers, it may be concluded that the phenols in that soil originate primarily from degraded lignin. Analogously, in profiles A and B the phenols may be derived mainly from N-containing proteinaceous biomass.
Monocyclic aromatic hydrocarbons (MAHs) account for 24 ± 2 % of TQPA. Toluene is the most abundant product, followed by benzene. These two compounds exhibit inverse depth trends (Fig. 4e). While toluene is correlated to the products of chitin (r2=0.31, P<0.05), benzene is correlated to pyrogenic N (r2=0.48, P<0.001). This behaviour may be expected from soil samples with large proportions of both proteinaceous biomass and pyrogenic matter. The other MAHs (xylenes and ethylbenzene) may have diverse origins, so that they cannot be allocated to a specific SOM component.
Polycyclic aromatic hydrocarbons (PAHs) account for 3.4 ± 0.7 % of TQPA. Here, the main source of these compounds is pyrogenic matter, i.e. Black C. PAHs increase with depth in soils B and C, but not in soil A (Fig. 4f).
The group of methylene chain compounds (MCC) includes homologous series of n-alkanes (C10-C33), n-alkenes (C10-C31), n-fatty acids (C16 and C18) and n-methylketones (C23, C25, C27 and C29), in addition to prist-1-ene. Combined, these compounds account for 34 ± 5 % of TQPA (Fig. 4g). The vast majority of this group can be ascribed to n-alkane/n-alkene pairs (30 ± 5 % of TQPA). The increase with depth in all soils can be explained by the resistance of aliphatic material during SOM degradation, in this case their relative preservation compared to mainly carbohydrates but also compared to chitin.
Other compounds (3.1 ± 1.4 % of TQPA) include methyliodine (m/z 142 and 127; 1.2 ± 0.7 % of TQPA), which is not frequently found in SOM pyroyzates (Fig. 4h). A possible source of this compound is halogenation: these clay-rich soils release significant amounts of I upon weathering which, in combination with the high microbial/biological activity, forms organo-iodine complexes through biotic halogenation. We checked for the presence of methylbromine (which should be formed through the same process; Martínez-Cortizas et al., 2016), and we identified this compound as well (m/z 94, 96). Quantification of Me-Br, not presented in the Appendix because it was not recognised in the initial scannings of the pyrograms, showed that it is correlated to Me-I (r2=0.72, P<0.001), with the relative proportion of Me-I and Me-Br being roughly 4:1. Other compounds detected are an aliphatic pyrolysis product with characteristic fragment ions m/z 83 and 280, frequently associated with fresh plant remains, and an unidentified polar compound with base ion m/z 135 (possibly from chitin).
3.2 Coupling of Py-GC-MS fingerprints and geo-archaeological information
It appeared that the SOM of the soils studied is a mixture of relatively intact plant-derived “labile” SOM (polysaccharides and lignin), aliphatic “recalcitrant” SOM (C10-C25 n-alkane/n-alkene pairs), “degraded/secondary” SOM (furfurals, chitin markers) and pyrogenic SOM (benzene, PAHs, benzonitriles, naphthalene carbonitriles), in varying relative proportions. Figure 5 shows the relative proportions of these groups, omitting all compounds of unspecific origin. It seems that the majority of the SOM originates from biotically (microbially or arthropodically) altered SOM (degraded/secondary SOM) and aliphatic “recalcitrant” SOM. This can be explained by the intensity of SOM degradation, eliminating most plant-derived labile components leaving the degraded/secondary (e.g. chitin) and recalcitrant SOM. Preferential decomposition of chitin may explain the relative increase in the proportions of pyrogenic and recalcitrant SOM with depth (profiles B and C). Note that these are only rough estimations that may be severely biased (e.g. because of low pyrolysability of pyrogenic matter).
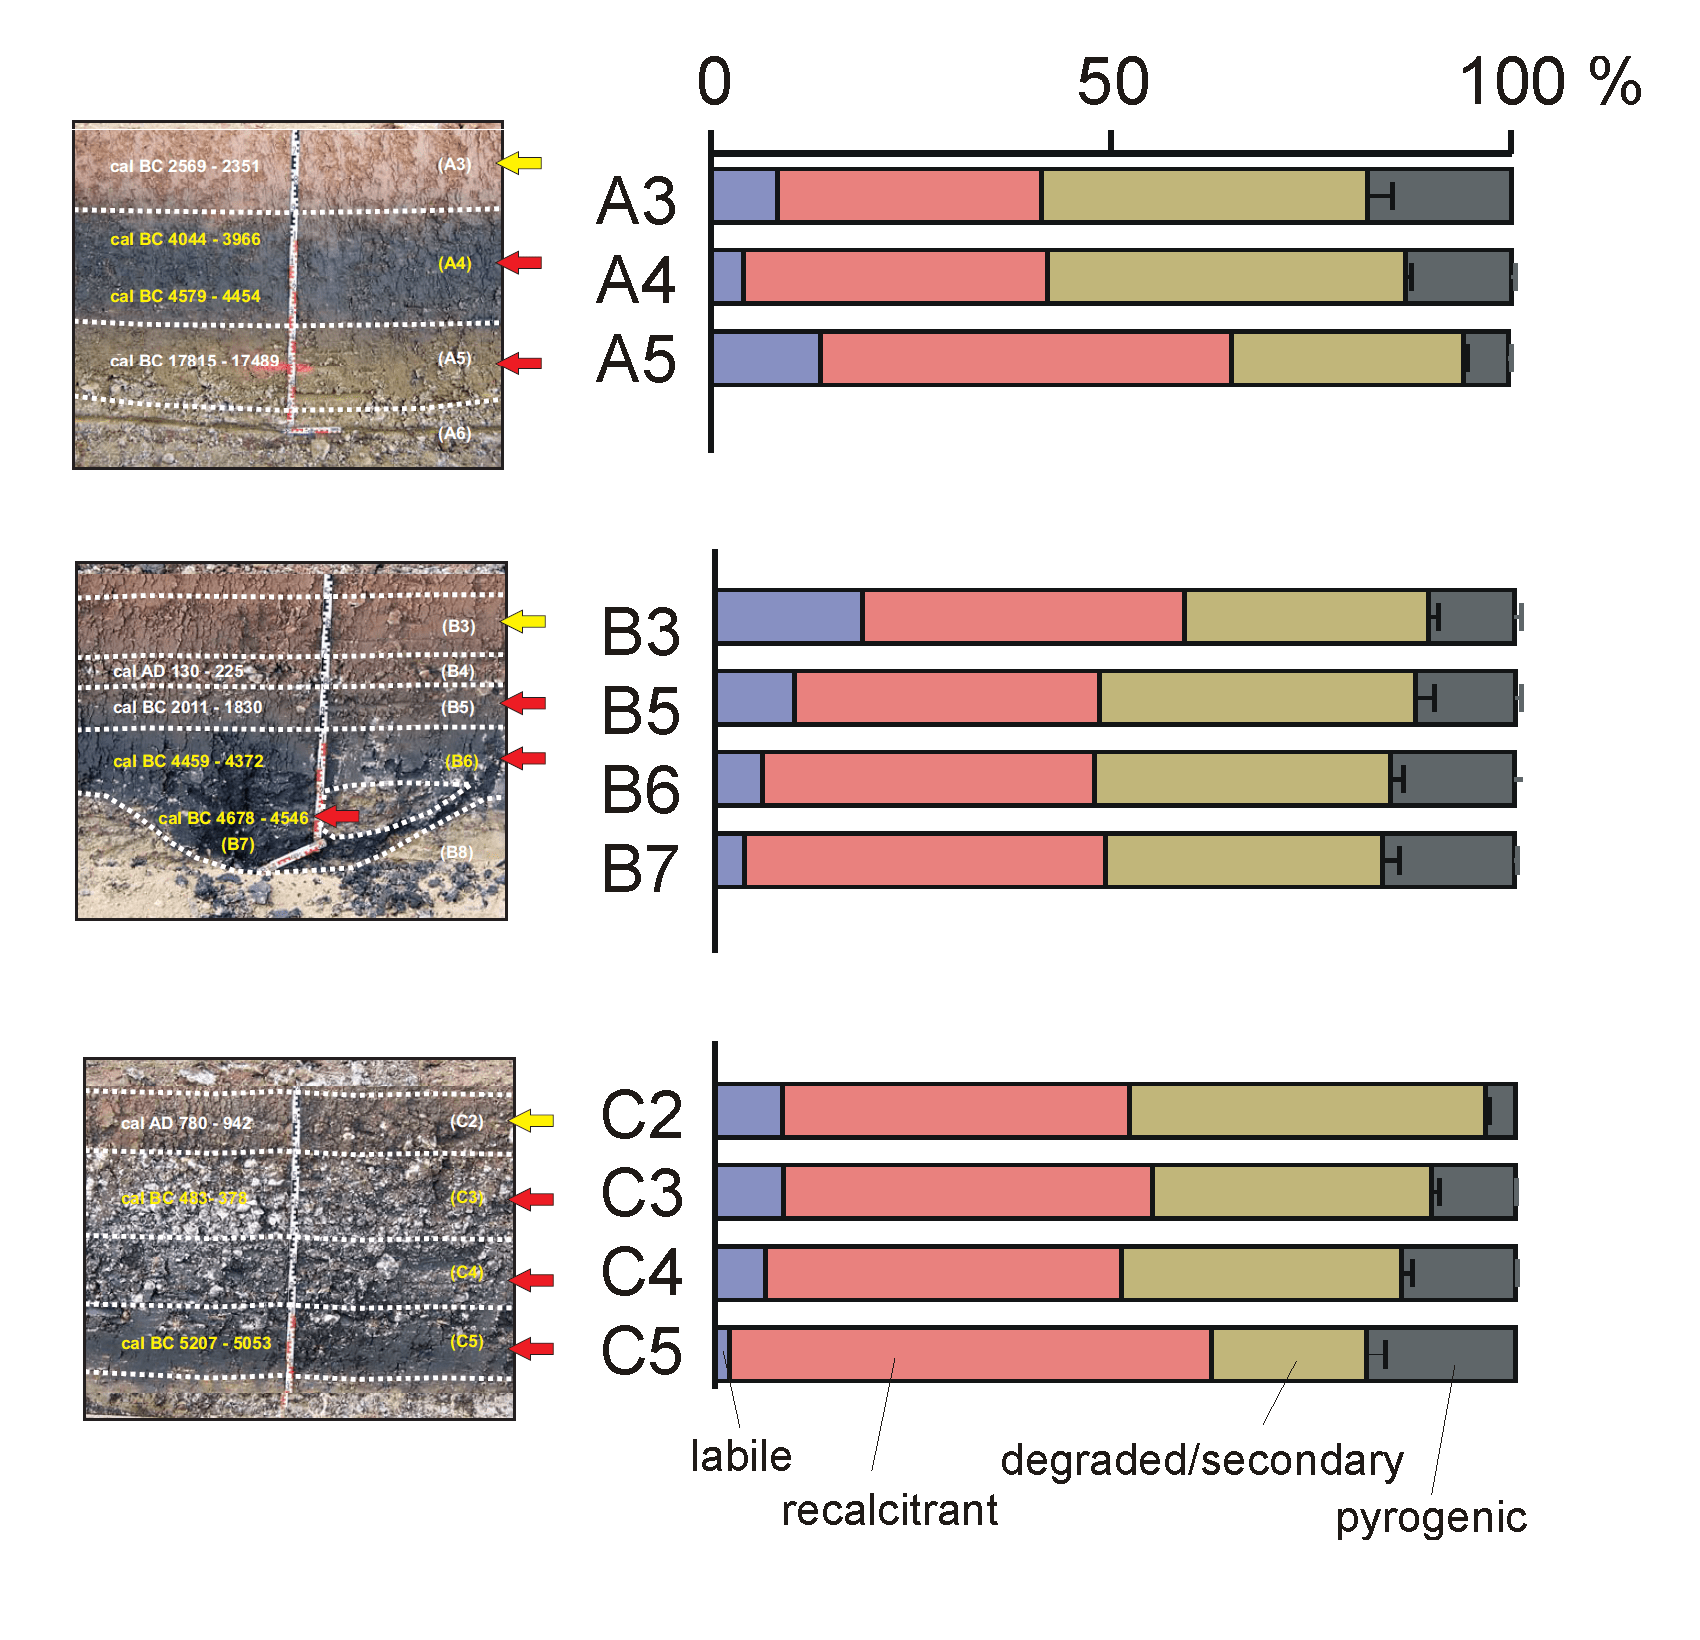
Profile A. Sample A5 corresponds to the Early Holocene (a post-glacial deposit ca. 14 ka old) and therefore contains no or very few fire residues. The fire regime had not started yet and the SOM is composed predominantly of recalcitrant aliphatic domains (from roots for example). Sample A4 is deep black in colour and has larger microbial and pyrogenic SOM contents. This corroborates the abundance macroscopic charcoal and suggests that the “black particles” mentioned by Mailänder et al. (2010) (referring to sample A4) indeed originate from fire residues, presumably from anthropogenic fire clearance during the Neolithic (upper and lower boundaries dated to 6000 and 6500 cal BP, respectively). Sample A3 (4500 cal BP) is an exception to the rule that the dark-coloured samples have highest Black C contents. It has a reddish colour and is clearly post-Neolithic. This may be related to its low C content (weak pigmenting effect of pyrogenic SOM) and/or the presence of Black C at the lower boundary between A3 and A4.
In profile B, a clear increase in pyrogenic SOM content is observed, culminating into the darkest levels that were dated to 6500 cal BP. Surface levels of profile B have a relatively high proportion of well-preserved plant remains.
A similar pattern is recognised in profile C. The youngest samples analysed here date to 1200 cal BP (sample C2, ca. 800 A.D.) and is a greyish layer that was formed well after the dark-coloured layers that formed more than 1000 years earlier (C3, 2500 cal BP). Sample C2 has no or very little pyrogenic SOM, whereas C3 has slightly higher levels. The highest proportion of pyrolysis products of Black C are found in samples C4 (not dated) and C5 (7000 cal BP), which are also deep black in colour.
4. Conclusions
The geo-archaeological survey already showed clear consistency in the depth-age records and determined age of the dark-coloured deeper layers: they correspond to a rather narrow age range between 6000 and 7000 years ago, corresponding to Neolithic fire events. It has now been established on the basis of molecular data that the black colour of these layers can indeed be safely ascribed to the abundance of Black C, i.e. fire residues. Clearly, considering their thickness, these dark layers correspond to a very intense recurrent fire regime. Early human-induced anthropogenic erosion processes could thus be dated as far back as the early Neolithic. According to Mailänder et al. (2010) it was probably caused by vegetation clearance and initial slash and burn agriculture. The abrupt shift in lighter materials after the Neolithic can be related to the absence of biomass (fuel) after deforestation: post-Neolithic sporadic burning of herbaceous vegetation in pasturelands or elimination of weeds from a fully converted agricultural landscape, of which evidence exists near Ipf, would not give rise to deep-black charcoal-rich colluvium.
REFERENCES
Kaal, J., Nierop, K.G.J., Martínez Cortizas, A., 2009. Characterisation of aged charcoal using a coil probe pyrolysis-GC/MS method optimised for Black Carbon. Journal of Analytical and Applied Pyrolysis 85, 408-416.
Kaal, J., Rumpel, C., 2009. Can pyrolysis-GC/MS be used to estimate the degree of thermal alteration of black carbon? Organic Geochemistry 40, 1179-1187.
Knicker, H., 2010. “Black nitrogen” – an important fraction in determining the recalcitrance of charcoal. Organic Geochemistry 41, 947-950.
Mailänder, S. Eberle, J., Blümel, W.D., 2010. Kolluvien, Auelehme und (An)moore im Umfeld des frühkeltischen Fürstensitzes auf dem Ipf – Ein Beitrag zur Geoarchäologie und Landschaftsgeschichte am Westrand des Nördlinger Rieses. In: Krausse, D.L., 2010, Frühe Zentralisierungs- und Urbanisierungsprozesse. Zur Genese und Entwicklung frühkeltischer Fürstensitze und ihres territorialen Umlandes. Kolloquium des DFG-Schwerpunktprogramms 1171.
Mailänder, S., Hecht, S., Eberle, J., Blümel, W.D., 2011. Geoarchäologische Erkundungen in zwei Muldentälchen östlich des Ipfs am Westrand des Nördlinger Rieses (Süddeutschland). Tagungen des Landesmuseum für Vorgeschichte Halle, Band 6, 129-144.
Martínez Cortizas, A., Ferro Vázquez, C., Kaal, J., Biester, H., Costa Casais, M., Taboada Rodríguez, T., Rodríguez Lado, L., 2016. Bromine accumulation in acidic black colluvial soils. Geochimica et Cosmochimica Acta 174, 143-155.
Schellekens, J., Buurman, P., Fraga, I., Martínez-Cortizas, A., 2011. Holocene vegetation and hydrologic changes inferred from molecular vegetation markers in peat, Penido Vello (Galicia, Spain). Palaeogeography, Palaeoclimatology, Palaeoecology 299, 55-69.
Table 1.
| Pyrolysis product | m/z | RT (min) | Group |
| I-methane | 142+127 | 1,689 | OTHER |
| Benzene | 78 | 2,145 | MAH |
| Toluene | 91+92 | 2,809 | MAH |
| xylenes (2 isomers) | 91+106 | 3,593 | MAH |
| 4-ethylbenzene | 91+106 | 3,894 | MAH |
| styrene | 104+78 | 3,878 | MAH |
| naphthalene | 128 | 6,447 | PAH |
| C1-naphthalene | 142+115 | 7,272 | PAH |
| C1-naphthalene | 142+115 | 7,401 | PAH |
| indene | 115+116 | 5,253 | PAH |
| C1-indene | 130+115 | 6,130 | PAH |
| biphenyl | 154+153 | 7,832 | PAH |
| C2-naphthalene (2 isomers) | 156+141 | 8,019 | PAH |
| dibenzofuran | 168+139 | 8,787 | PAH |
| fluorene | 165+166 | 9,197 | PAH |
| phenanthrene | 178 | 10,385 | PAH |
| phenol | 94+66 | 4,984 | PHEN |
| C1-phenol (2 isomers) | 108+107 | 5,539 | PHEN |
| C2-phenol | 107+122 | 6,250 | PHEN |
| guaiacol | 109+124 | 5,684 | LIG |
| 4-vinylguaiacol | 150+135 | 7,401 | LIG |
| 3/2-furaldehyde | 95+96 | 3,370 | CARB |
| 5-methyl-2-furaldehyde | 110+109 | 4,594 | CARB |
| pyran comp | 114+58 | 5,004 | CARB |
| dianhydrorhamnose | 128+113 | 5,352 | CARB |
| levoglucosenone | 68+98 | 5,918 | CARB |
| unidentified carbohydrate | 116 | 8,958 | CARB |
| levoglucosan | 60+73 | 9,321 | CARB |
| N-methylpyrrole | 81+80 | 2,612 | NCOMP |
| pyridine | 79+52 | 2,727 | NCOMP |
| pyrrole | 67 | 2,768 | NCOMP |
| C1-pyridine | 93+66 | 3,307 | NCOMP |
| C1-pyrrole (2 isomers) | 80+81 | 3,546 | NCOMP |
| acetamide | 59 | 3,800 | NCOMP |
| benzonitrile | 103+76 | 4,807 | NCOMP |
| unidentified N-compound | 109 | 4,999 | NCOMP |
| benzeneacetonitrile | 117+90 | 6,032 | NCOMP |
| C1-benzonitrile | 117+90 | 6,110 | NCOMP |
| indole | 117+90 | 7,373 | NCOMP |
| naphthalene carbonitrile | 153+126 | 8,716 | NCOMP |
| phthalimide | 147+76 | 8,823 | NCOMP |
| trianhydro-2-acetamido-2-deoxyglucose | 125+167 | 8,870 | NCOMP |
| naphthalene carbonitrile | 153+126 | 8,906 | NCOMP |
| unidentified N-compound | 94 | 9,186 | NCOMP |
| C1-phthalimide | 161 | 9,285 | NCOMP |
| C1-phthalimide | 161 | 9,550 | NCOMP |
| diketodipyrrole | 186+93 | 10,011 | NCOMP |
| C16 alkylnitrile | 97+110 | 10,748 | NCOMP |
| 2,5-diketopiperazine | 70+194 | 11,303 | NCOMP |
| C18 alkylnitrile | 97+110 | 11,734 | NCOMP |
| C16 alkylamide | 59+72 | 12,175 | NCOMP |
| C18 alkylamide | 59+72 | 13,041 | NCOMP |
| unidentified compound | 135+165 | 7,505 | OTHER |
| unidentified compound | 83+280 | 12,787 | OTHER |
| steroid/triterpenoid | 396+147 | 15,807 | OTHER |
| C10-alkene | 55+69 | 4,693 | MCC |
| C10-alkane | 57+71 | 4,760 | MCC |
| C11-alkene | 55+69 | 5,518 | MCC |
| C11-alkane | 57+71 | 5,596 | MCC |
| C12-alkene | 55+69 | 6,312 | MCC |
| C12-alkane | 57+71 | 6,369 | MCC |
| C13-alkene | 55+69 | 7,038 | MCC |
| C13-alkane | 57+71 | 7,090 | MCC |
| C14-alkene | 55+69 | 7,733 | MCC |
| C14-alkane | 57+71 | 7,775 | MCC |
| C15-alkene | 55+69 | 8,392 | MCC |
| C15-alkane | 57+71 | 8,413 | MCC |
| C16-alkene | 55+69 | 8,989 | MCC |
| C16-alkane | 57+71 | 9,031 | MCC |
| C17-alkene | 55+69 | 9,586 | MCC |
| C17-alkane | 57+71 | 9,601 | MCC |
| prist-1-ene | 55+56 | 9,783 | MCC |
| C18-alkene | 55+69 | 10,115 | MCC |
| C18-alkane | 57+71 | 10,151 | MCC |
| C19-alkene | 55+69 | 10,644 | MCC |
| C19-alkane | 57+71 | 10,681 | MCC |
| C20-alkene | 55+69 | 11,137 | MCC |
| C16 fatty acid | 60+73 | 11,137 | MCC |
| C20-alkane | 57+71 | 11,142 | MCC |
| C21-alkene | 55+69 | 11,635 | MCC |
| C21-alkane | 57+71 | 11,651 | MCC |
| C22-alkene | 55+69 | 12,030 | MCC |
| C18 fatty acid | 60+73 | 12,030 | MCC |
| C22-alkane | 57+71 | 12,092 | MCC |
| C23-alkene | 55+69 | 12,491 | MCC |
| C23-alkane | 57+71 | 12,528 | MCC |
| C24-alkene | 55+69 | 12,922 | MCC |
| C24-alkane | 57+71 | 12,948 | MCC |
| C25-alkene | 55+69 | 13,332 | MCC |
| C25-alkane | 57+71 | 13,342 | MCC |
| C26-alkene | 55+69 | 13,711 | MCC |
| C26-alkane | 57+71 | 13,716 | MCC |
| C27-alkene | 55+69 | 14,090 | MCC |
| C27-alkane | 57+71 | 14,090 | MCC |
| methylketone | 58+59 | 14,183 | MCC |
| C28-alkane | 57+71 | 14,442 | MCC |
| C28-alkene | 55+69 | 14,448 | MCC |
| C29-alkane | 57+71 | 14,795 | MCC |
| methylketone | 58+59 | 14,904 | MCC |
| C30-alkane | 57+71 | 15,127 | MCC |
| C29-alkene | 55+69 | 15,132 | MCC |
| C30-alkene | 55+69 | 15,496 | MCC |
| C31-alkane | 57+71 | 15,501 | MCC |
| methylketone | 58+59 | 15,605 | MCC |
| C31-alkene | 55+69 | 15,869 | MCC |
| C32-alkane | 57+71 | 15,874 | MCC |
| C33-alkane | 57+71 | 16,295 | MCC |
| methylketone | 58+59 | 16,456 | MCC |